Thailand : Trade Balance, Exports and Imports (Jan-Sep 2020)
This page has been SUPERSEDED by the summary of trade for the whole of 2020
Trade is very important and a major component contributing to the GDP of Thailand. The first half of 2020 saw the emergence of the Covid-19 virus, causing a pandemic around the world, especially causing a decrease in economic growth around the world and also in Thailand. The effect was even more pronounced during the second quarter of the year, when a lot of countries were in lockdown at least for a few weeks. During the third quarter a second wave ravaged through Europe, and the U.S.A. and many other trading partners still had persistent Covid-19 infections.
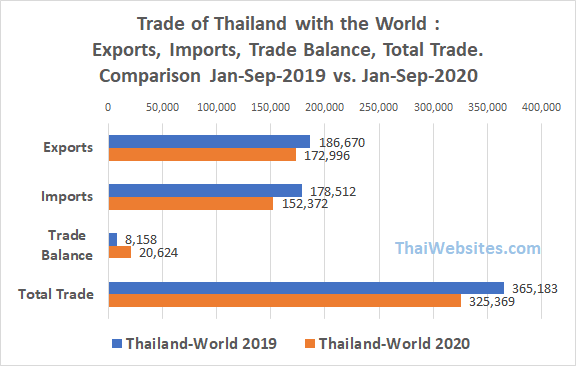
In Thailand, both imports (-14.64 %) and exports (-7.33 %) decreased substantially, causing a decrease in Total Trade by 10.90 %.
Strikingly, the trade balance remains positive for the first three quarters of 2020 and more than doubled when compared to the same period of the previous year, to 12.466 billion U.S. Dollar.

Exports, Imports, Trade Balance, and Total Trade of Thailand. For the Januari to September period of 2020, compared to the same periodof 2019. In million U.S. Dollars.
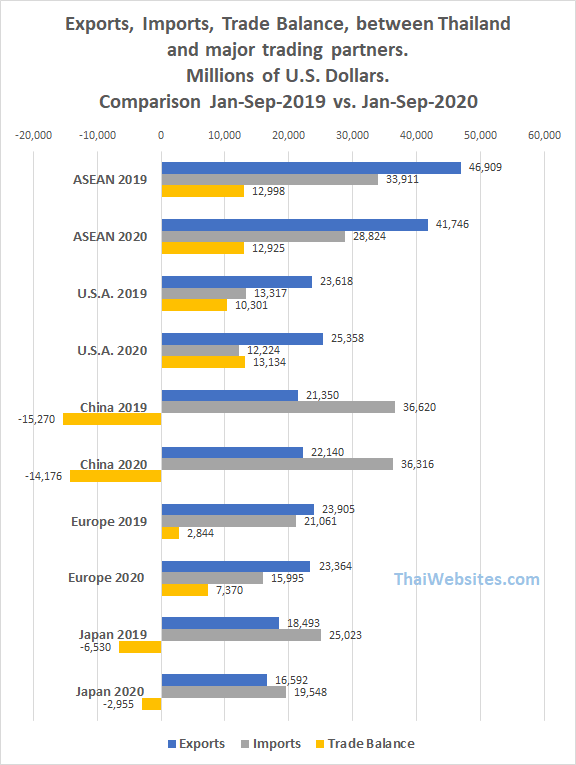
When looking at trading between Thailand and its major partners, there are some interesting observation. Trade with ASEAN countries decreased substantially, both imports (-15%) and exports (-11%).
The trade balande with the U.S.A. widened further (hopefully this will not lead to trade restrictions) to 13.134 billion U.S. Dollar. This mainly due to an increase of exports from Thailand by 1.740 billion U.S. Dollar, and a decrease in imports by 1.093 billion U.S. Dollar. Trade with China, was relatively unchanged from the previous year, and China remains the main import source in Thai trade.
There was a dramatic decrease in imports of European goods, from 21.061 billion U.S. Dollar to 15.995 billion U.S. Dollar (-24 %). Not sure what this is all about. Export to Europe essentially stayed the same.
A similar dramatic decrease in imports from Japan was present, from 25.023 billion U.S. Dollar to 19.548 billion U.S. Dollar (-21.9 %). Exports to Japan also decreased by 10.3 %.

Exports to and Imports from Thailand's major trading partners. Comparing first three Quarters of 2019 with same period of 2020.
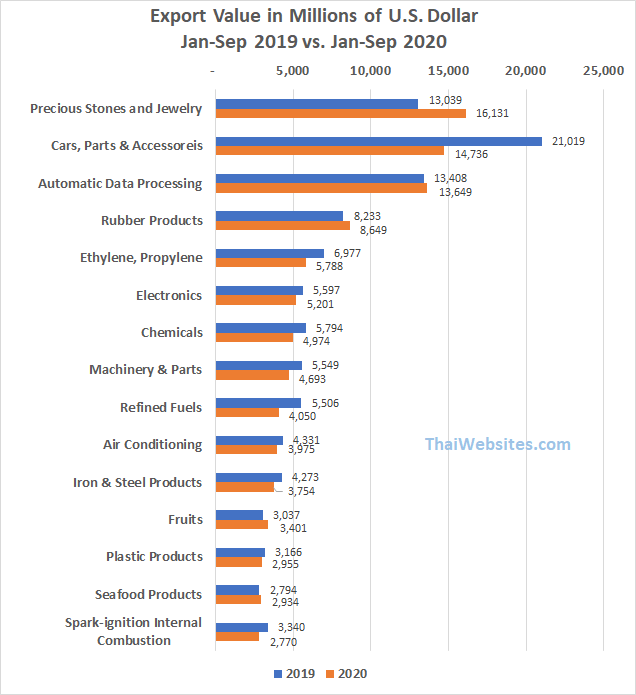
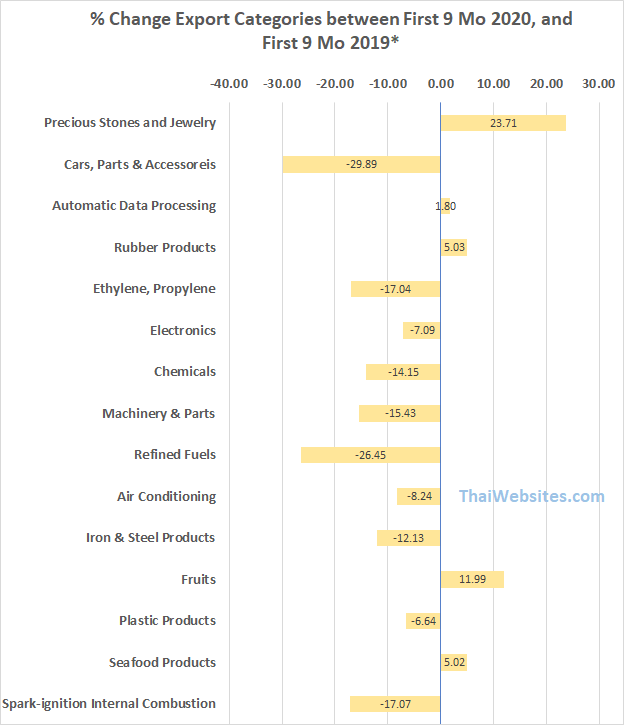
When looking at the value of exports, we see that most categories of goods were exported less (value) than in the first three quarters of 2020.
Striking is the decrease in cars, car parts and accessories, which saw a drop in export value from 21.02 billion U.S. Dollar, to 14.74 billion U.S. Dollar, likely in line with less car sales all around the world. The value of most categories was mostly in line with the average overall decrease in exports. Exports of fruits increased though, and we understand this is mostly caused by ever increasing exports of durian to China.
With the Covid-19 pandemic, one would have expected more value in exporting rubber products (like for gloves), but this somehow did not happen.
What is also interesting is the substantial increase in export value of precious stones and likely mostly gold. This category already saw an increase of exported value during 2019 (compared with 2018). The price of gold has gone up a lot during the first half of 2020. At the same time, Thai people may be in need of cash. For both reasons, it looked like a good time to sell gold, to the many gold shops around Bangkok, and Thailand.
We discovered that local gold traders don't like to accumulate gold, and do not store it apparently in their vaults or in some safe location created for that purpose. They sell it on the global market. So if the value of exports of gold increases, it simply means local gold shops have offloaded their gold on the international market. (Thailand does not at present, have any substantial gold mining). Of course, with the increase in the price gold, less gold is necessary to create increased export value, compared to the previous year.

Value of exported products from Thailand, first 9 months of 2020, compared to same period of 2019.

Percentual Change in Export Value for different categories. Comparison between first 9 months of 2019 and 2020.
Resources : Data as provided on the website of the Ministry of Commerce

